

Learning Intention: We are learning to search the text to answer questions, and identify the 3-4 most important points/facts in a text.
Success Criteria:
# I can search the text for answers to questions, using the keywords in the question to help me.
# I can identify the 3-4 most important pieces of information in a text and write them in dot points.

(Tuesday) Independent Reading – 20mins
Prompt question (after reading) =
Summarise the 4 most important details/events in your book (in pages you have read so far…)
Reading Activity – Read the Text and answer the questions
TUESDAY – Sustainability (Text)
Q1 – What does sustainability mean?
Q2 – Explain the ‘3 pillars of sustainability’
Q3 – Explain why you think 1 person can make a difference to sustainability
Q4 – Summarise the most important 4 details.


Split Spelling – make columns <oo> <o-e> <ew> <ou>
Sort all the spelling words on the list into these columns, if time find more in your home readers. Can you sort all the words on the word list?
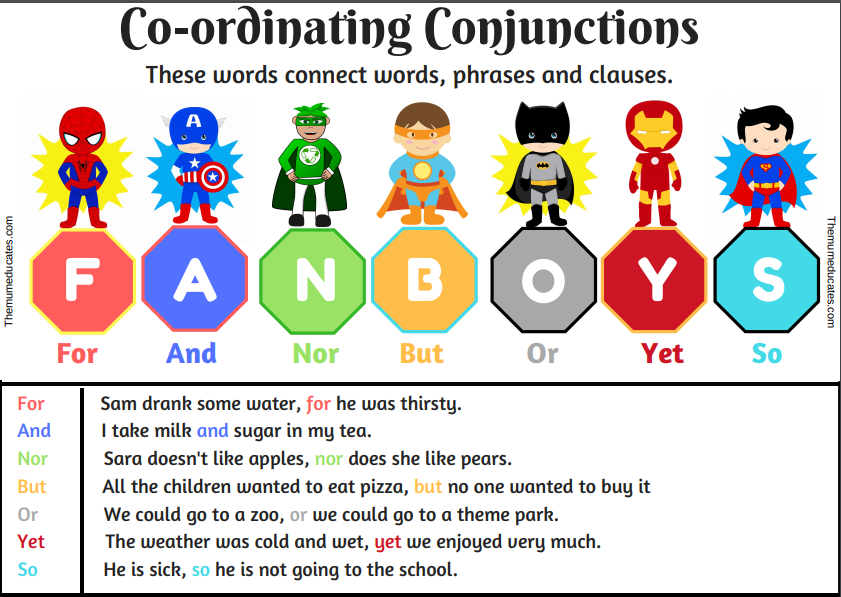
Writing: We are learning to make compound sentences with conjunctions.
We can:
-
- Identify simple sentences (find the topic noun)
- Join two simple sentences with a conjunction.
- Rewrite sentences as compound sentences.
Click here to find your work for today.
Today’s task: You will see some simple sentences about what happens to paper and cardboard. Join the 2 simple sentences together, with a conjunction, to make a compound sentence. Write your sentences down the bottom.

 Practice your counting goal for 5 min.
Learning Intention:
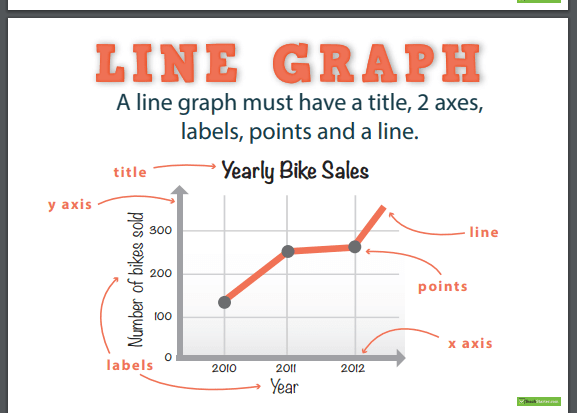
We are learning to interpret data and present our findings in a Line Graph.
Success Criteria:
I can:
- Represent the data in a Line graph.
- Draw a vertical axis (y axis) and horizontal axis (x axis) correctly.
- Draw numbers along the y axis and the choices along the x axis.
- Draw straight lines using a ruler.
- Include a title for my graph.
- Draw lines, linking the dots together.
- Present my work neatly.
Line Graphs
A line graph is used to display information which changes over time. It is plotted on a graph as a series of points joined with straight lines.
Activity:
John leaves for a road trip on his motorbike for seven days. The number of kilometres covered by him per day is presented in a table below. Analyse the data and present your findings in a line graph.
|
Day Of Travel |
Distance travelled (km) |
| Monday | 70 |
| Tuesday | 65 |
| Wednesday | 42 |
| Thursday | 25 |
| Friday | 71 |
| Saturday | 70 |
| Sunday | 36 |
Click here to print off grid paper or draw your graph in your homework book.
Remember to include –
- X and Y axis
- Title
- Labels
- Scale
Question: How far did John travel over the seven day trip?
Extension: IXL Activities –
Find the following numbers in your recommendations.
Grade 4: H.4 H.5
Grade 5: Q.2 Q.3
Grade 6: CC.15 CC.16

# Continue researching your Sustainable Topic for your writing planner. Have you got 3-4 facts under each subtitle (Who, What, When, Where, Why, How). If your planner or planning is at school, work on collecting more dot points in your homework book (aim for 10 new facts).
#Continue working on Making Sustainable Change action plan. Some students are still finishing off their action plan. What will you need at school on Monday to begin making your campaign poster, video etc ?